No investment advice. This is a report on an experiment with a paper portfolio, and nothing in it is a recommendation to buy or sell anything.
My feed has been full of posts promising that AI will make you rich on the stock market. A screenshot of returns, a bot, a link. Most of it reads like a scam to me. I still wanted to know whether something like this can work at all, and how you would even tell.
The idea behind the model
The idea is old and simple. When a whole sector rises but one company in it doesn’t keep up, that is often just a delay: money reaches the well-known names first and the laggards later. The counter-risk is just as clear. Some laggards lag because something is wrong with the company.
Every US trading day the model screens 953 stocks: everything in the S&P 500 and the S&P MidCap 400, plus 50 added names that are in neither index. Each stock belongs to one of 11 sectors and gets compared with three things: the average of the other stocks in its sector, a fund that tracks the sector, and a large sector leader. A stock only becomes interesting when all three have risen over the last 20 days and it has clearly fallen behind. The clearest cases get a grade, and only the best grade can trigger a buy.
The portfolio holds at most three stocks at a time, each with about a third of the money. Fixed rules decide when to sell: a stop at −8%, a stop that moves up as the position gains, a target, a time stop after ten days without movement and a maximum of 60 days. Nobody steps in by hand.
The backtest that looked too good
Before the paper portfolio started, I ran the rules backwards over the past years. The result was +17.7% a year. After fixing a calculation bug, where every day had been processed twice, it even looked like +29.5%. Those are exactly the kind of numbers in the posts that make me sceptical.
The problem was the universe. I had run the backtest on the stocks that are in the index today, so every company that went bankrupt, was taken over or dropped out in recent years was missing. When I rebuilt the universe as it really looked in March 2022, including all the companies that later didn’t make it, the same rules lost 8.4% a year.
The reason is uncomfortable. The model cannot tell a laggard that is about to catch up from a company on its way out. 60% of its buys landed in companies that later left the index, at −1.41% per trade on average. The survivors made +1.13%. The first backtest had simply never seen the first group.
Why I kept going
A live test only ever sees the stocks that exist on the day, so it cannot repeat the mistake of the first backtest. The truth for this strategy lies somewhere between the two backtests, probably closer to the pessimistic one, and the only way to find out where is to let it run forward. On paper that costs nothing.
What hasn’t changed is the weakness itself. None of the later rule changes teaches the model to spot a company in decline. A good run can also mean that few such companies happened to show up.
Five months on paper
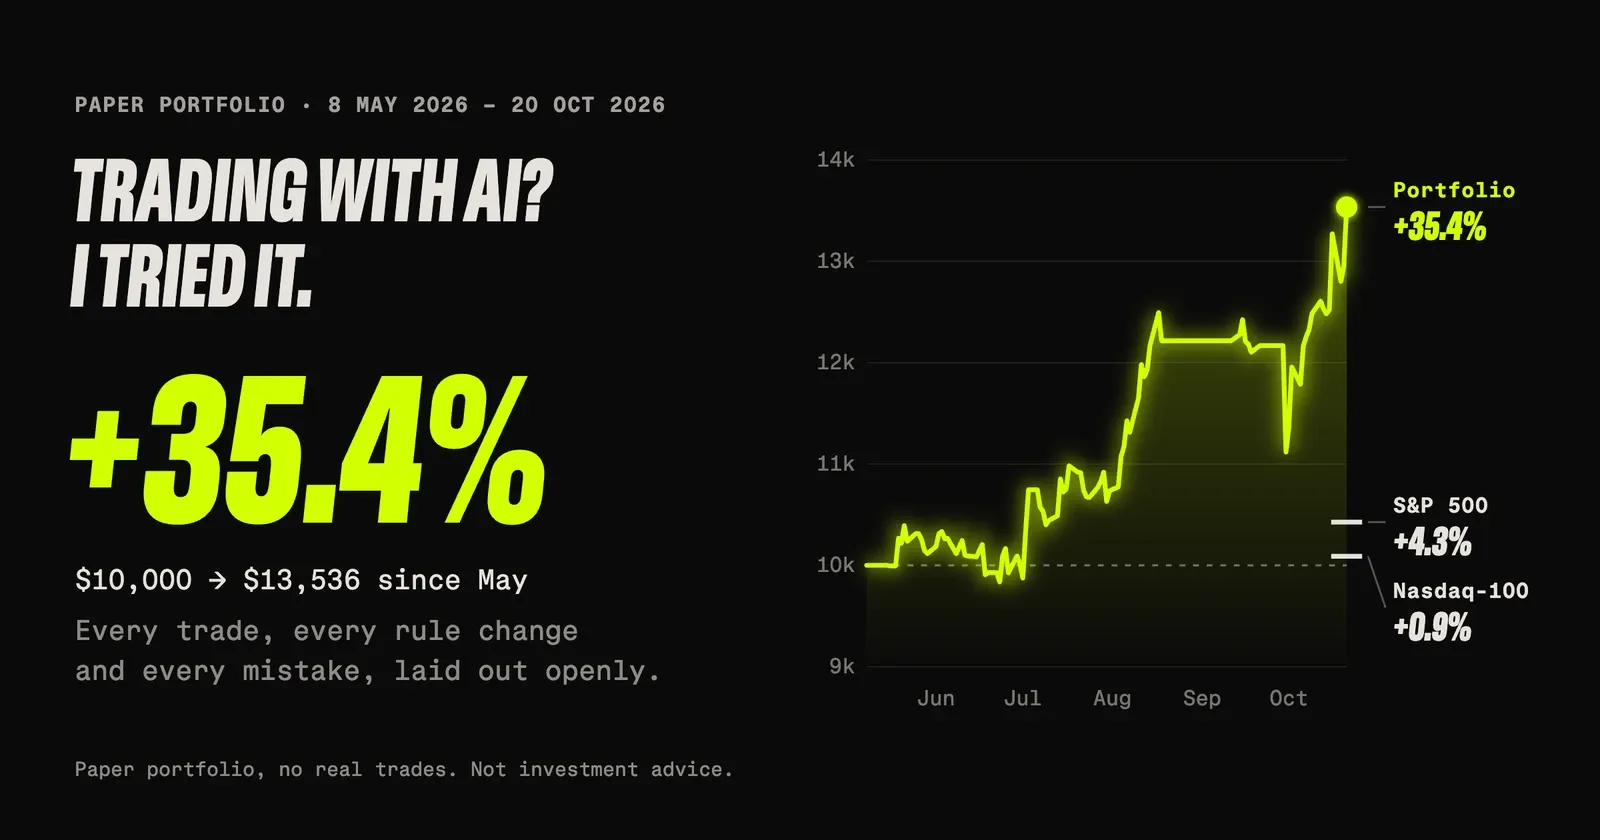
The portfolio started on 8 May 2026 with $10,000. On 21 October it stood at $13,536, up 35.4%. Over the same period the S&P 500 rose 4.3% and the Nasdaq-100 0.9%, both measured on their index funds, without dividends.
That looks great and proves very little so far. About 60% of the gain still sits in three open positions and can disappear again. Of the 18 closed trades, nine made money and nine lost. The median trade made 0.28%. Two trades together made more than the entire realised gain.
The biggest loss was FICO: −26.6% in a single day, almost a tenth of the starting capital. The buy was booked at the previous close, the stock opened far lower after news, and the −8% stop, checked once a day on the close, didn’t help. All three stop sales ended below −8%. A stop only limits a loss when the price gets there gradually.
I also changed the rules seven times along the way. Since 2 October the portfolio only buys 30 minutes after the US open at the price you could actually get, and the honest count starts there. Under those rules, none of the 20 trades I want to see before judging anything has closed yet.
What AI actually did
Without AI I would not have got anywhere near this far. Together with an AI assistant I developed the model and its rules, built the application that runs the screens and the portfolio, and I use it to keep all of that running every day.
Most of the work, though, went into checking. With AI I rebuilt the backtest with the companies that later failed, measured which parts of the model carry any weight, and found that the screener had been scoring stocks whose prices had stopped updating. The simple laggard screen held up in that measurement: across 1,009 candidates it beat the market by about 1% in the following weeks. The fine-tuning on top added nothing measurable.
That checking is the part the posts in my feed leave out, and it is where AI helped me most.
What I don’t know yet
Whether this is skill or luck. Whether it holds under the current rules. Whether the months since May were typical. And how much of October will still be there in a few weeks.
The full report, with every closed trade, every rule change and the open questions, is here. I’ll update it every few weeks.
New pieces go out by mail first.
Subscribe on Substack